User's Guide
Performance is the way a computer system behaves given a particular
workload. It is affected by the resources available and how they are used and
shared.
If you want to improve performance, you must first decide what you mean by
performance. You can choose many different performance metrics,
including:
- Response time
- The interval between the time that the application sends the database
request and the time that the application receives a response.
- Transaction throughput
- The number of units of work that can be completed per unit of time. The
unit of work could be simple, like fetching and updating a row, or
complicated, involving hundreds of SQL statements.
- Data transfer rate
- The number of bytes of data transferred between the DB2 Connect
application and the DRDA database per unit of time.
Performance will be limited by the available hardware and software
resources. CPU, memory and network adapters are examples of hardware
resources. Communication subsystems, paging subsystems, mbuf for
AIX, and link for SNA are examples of software resources.
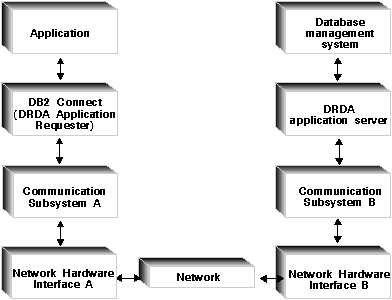
Figure 8 shows the path of data flowing between the DRDA database and the workstation
through DB2 Connect.
Figure 8. Data Flows in DB2 Connect

|
- The DRDA database and part of communication subsystem B are usually
running on the same system. This system is made up of one or more CPUs, main
storage, an I/O subsystem, DASD, and an operating system. Because other
programs may share these components, resource contention could cause
performance problems.
- The network is composed of a combination of cables, hubs, communication
lines, switches, and other communication controllers. For example, the network
hardware interface B could be communication controllers such as 3745 or 3172
or a token ring adapter for an AS/400. There could be more than one
transmission medium involved between network hardware interfaces A and B.
- Network hardware interface A could be token ring, Ethernet**, other LAN
adapter, or an adapter which supports the SDLC or X.25 protocols.
Communication subsystem A might be a product such as IBM Communications Server
for OS/2, Microsoft SNA Server, IBM SNA Server for AIX, or SNAplus for
HP-UX.
- The DB2 Connect product and the communication subsystem A are usually
located on the same system. In this chapter, we assume that the application is
also on the same system.
Transaction throughput is dependent on the slowest component in the system.
If you identify a performance bottleneck, you can often alleviate the problem
by changing configuration parameters, allocating more resources to the problem
component, upgrading the component, or adding a new component to offload some
of the work.
You can use various tools to determine how much time a query spends in each
component. This will give you an idea of which components should be tuned or
upgraded to improve performance. For example, if you determine that a query
spends 60% of its time in the DB2 Connect machine, you might want to
tune DB2 Connect or (if you have remote clients) add another DB2 Connect
machine to the network.
For more information about performance tools, see "Performance Tools".
Benchmarking is a way to compare performance in one environment with
performance in another.
Benchmarking can begin by running the test application in a normal
environment. As a performance problem is narrowed down, specialized test cases
can be developed to limit the scope of the function that is tested and
observed.
Benchmarking does not need to be complex. Specialized test cases need not
emulate an entire application in order to obtain valuable information. Start
with simple measurements and increase the complexity only when warranted.
Characteristics of good benchmarks (or measurements) include:
- Each test is repeatable.
- Each iteration of a test is started in the same system state.
- The hardware and software used for benchmarking matches your production
environment.
- There are no functions or applications active in the system other that
those being measured (unless the scenario includes some amount of other
activity going on in the system).
| Note: | Applications that are started use memory even when they are minimized or
idle. This could cause paging and skew the results of the benchmark.
|
The following table lists some of the tools that can help you measure
system performance. Because these tools themselves use system resources, you
might not want to have them active all the time.
Table 6. Performance Tools
| System
| Tool
| Description.
|
| CPU and memory usage
|
| AIX
| vmstat, time, ps, tprof
| Provide information about CPU or memory contention problems on the DB2
Connect workstation and remote clients
|
| HP-UX
| vmstat, time, ps, monitor and glance if available
|
|
| OS/2
| SPM/2, THESEUS/2, pstat
|
|
| Win NT
| MS Performance Monitor
|
|
| Database activity
|
| All
| Database monitor
| Determines if the problem originates from the database.
|
| MVS or OS/390
| DB2PM (IBM), OMEGAMON/DB2 (Candle), TMON (Landmark), INSIGHT (Goal
Systems) and DB2AM (BMC)
|
|
| Win NT
| MS Performance Monitor
|
|
| Network activity
|
| AIX
| netpmon
| Reports low level network statistics, including TCP/IP and SNA statistics
such as the number of packet or frames received per second.
|
| DOS or OS/2
| Token-Ring Network 16/4 Trace and Performance Program
| Most network monitors are platform dependent; this tool works for
token-ring only.
|
| Network controller such as 3745
| NetView Performance Monitor
| Reports utilization of communication control and VTAM
|
| OS/2
| DatagLANce
| A trace tool that presents performance-related data to users graphically.
|
| UNIX-based
| netstat
| Handles TCP/IP traffic
|
[ Top of Page | Previous Page | Next Page | Table of Contents | Index ]
[ DB2 List of Books |
Search the DB2 Books ]


