Administration Getting Started
Visual Explain is a tool for analyzing and tuning SQL statements. It
presents a graphical view of the access plan for explained SQL statements.
Tables and indexes, and each operation on them, are represented as nodes, and
the flow of data is represented by the links between the nodes. You can use
the information available from this graph to find ways to tune your SQL
queries for better performance.
Visual Explain captures information about how SQL statements are
compiled. This information allows you to understand the plan and potential
execution performance of SQL statements.
This information can help you:
- Assist in designing application programs.
- Assist in database design.
- Understand how two tables are joined: the join method, the order in
which the tables are joined, and the occurrence and type of sorts.
- Determine ways of improving the performance of SQL statements (for
example, by creating a new index).
- View the statistics that were used at the time of optimization. You can
then compare these statistics to the current catalog statistics to help you
determine whether re-binding the package might improve performance. It also helps you determine whether collecting statistics might
improve performance.
- Determine whether or not an index was used to access a table. If an index
was not used, Visual Explain can help you determine which columns could be
included in an index to help improve query performance.
- View the effects of performing various tuning techniques for the purpose
of better performance, by comparing the before and after versions of the
access plan graph for a query.
- Obtain information about each operation in the access plan, including the
total estimated cost and number of rows retrieved.
This section provides a simple example of how to get started analyzing a
dynamic SQL query.
- From the Control Center, click mouse button 2 on the SAMPLE database, and
select Explain SQL from the pop-up menu. The Explain SQL Statement
window opens.
- In the SQL text field, enter the following SQL statement:
select * from staff order by name
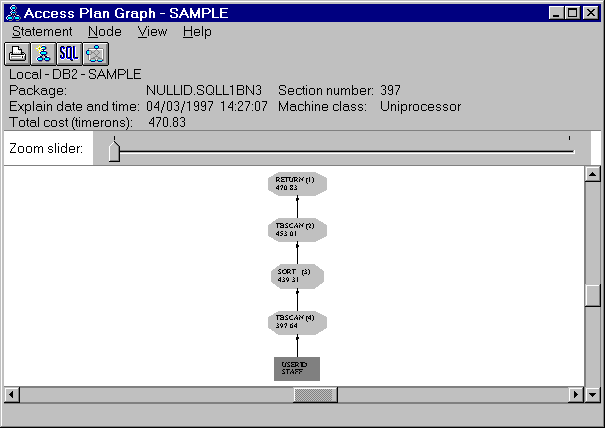
- Click on OK. The Access Plan Graph window opens. The graph
represents the path that the optimizer chose as the most efficient in order to
provide the results for your query.
Figure 26. Access Plan Graph
- Optional: Double-click on any of the nodes (for example, the RETURN
operator node). The Operator Details window opens, showing the details for
that operator.
The explained SQL statement is saved automatically. To view it later:
- From the Control Center, click mouse button 2 on the SAMPLE database, and
select Show explained statements history from the pop-up menu. The
Explained Statements History window opens.
- Locate the entry you want. You can look at the SQL text column
to see the SQL statement you had previously explained.
- Click mouse button 2 on the entry, and select Show access plan
from the pop-up menu. The Access Plan Graph window opens.
The online help for Visual Explain (accessible from the Help
menu) provides details on how to interpret the Access Plan Graph window in
order to improve the performance of SQL statements. The online help also contains detailed examples to help you learn
how to use Visual Explain. From the online help's table of contents, see
the heading "Analyzing SQL statements using Visual Explain", and the
subheading "Introduction to Visual Explain".
[ Top of Page | Previous Page | Next Page | Table of Contents | Index ]
[ DB2 List of Books |
Search the DB2 Books ]