
The output of an event monitor is a binary stream of data structures that are exactly the same for both pipe and file event monitors. You can format this trace using the db2evmon productivity tool.
Event Monitor records are defined in the sqlmon.h header file. You can look at the comments included in that file to see exactly which data elements are returned for each event type.
The following table illustrates the order in which records may appear in the event monitor stream. See "Information Available from Event Monitors" for a list of events that trigger the writing of event records. Records in a trace are logically divided into three sections:
| Record type | Record name | Information returned |
|---|---|---|
| Prologue | ||
| Event Log Header | sqlm_event_log_header | Characteristics of the trace, for example server type and memory layout. |
| Database Header | sqlm_dbheader_event | Database name, path and activation time. |
| Event Monitor Start | sqlm_evmon_start_event | Time when the monitor was started or restarted. |
| Connection Header | sqlm_connheader_event | One for each current connection, includes connection time and application name. |
| Actual Contents (may appear mixed in with other connections). | ||
| Connection Header | sqlm_connheader_event | One for each connection after activation, includes connection time and application identification. |
| Statement Event | sqlm_stmt_event | Statement level data, including text for dynamic statements. |
| Transaction Event | sqlm_xaction_event | Transaction level data. |
| Connection Event | sqlm_conn_event | Connection level data. |
| Deadlock Event | sqlm_deadlock_event | Deadlock level data. |
| Deadlocked Connection Event | sqlm_dlconn_event | One for each connection involved, includes applications involved and locks in contention. |
| Overflow | sqlm_overflow_event | Number of records lost - generated when reader cannot keep up with a (non-blocked) event monitor. |
| Epilogue | ||
| Database Event | sqlm_db_event | Database level data. |
| Buffer Pool Event | sqlm_bufferpool_event | Buffer pool level data. |
| Table Space Event | sqlm_tablespace_event | Table space level data. |
| Table Event | sqlm_table_event | Table level data. |
Note: Event records may be generated for any connection and may therefore appear in mixed order in the stream. This means that you may get a transaction event for Connection 1, immediately followed by a connection event for Connection 2. However, records belonging to a single connection or a single event, will appear in their logical order. For example, a statement record (end of statement) always precedes a transaction record (end of UOW), if any. Similarly, a deadlock event record always precedes the deadlocked connection event records for each connection involved in the deadlock. The application id or application handle (agent_id) can be used to match records with a connection.
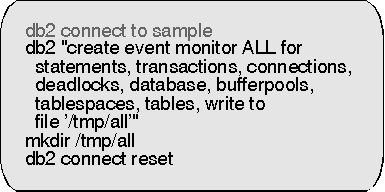
For example, using the following event monitor,
 |
the following workload,
 |
the following trace might be generated. Listed in this sample are some of the fields in each event record to give a flavor of the type of information contained in a trace. See "Event Monitors" for an example of deadlock events. Note, the numbers in this sample are used to illustrate the order in which records have been written.
PROLOGUE
The Prologue information is generated when set event monitor all state 1 is executed. If this event monitor had been AUTOSTART, it would have been generated when the database was activated.
1) sqlm_event_log_header
      version:            SQLM_DBMON_VERSION5  - Trace was produced by UDB V5
      num_nodes_in_db2_instance: 1             - for a standalone system,
      byte_order:         SQLM_BIG_ENDIAN      - on a UNIX or AIX box,
      event_monitor_name: ALL                  - by event monitor: 'ALL'

2) sqlm_dbheader_event
      db_name:            SAMPLE               - for database 'SAMPLE'

3) sqlm_connheader_event
      agent_id: 14                             - Application 1 - handle
      appl_id:  *LOCAL.bourbon.970602180712    - Application 1 - id with timestamp
|
CONTENTS
Generated when Application 1 issues select name from syscat.eventmonitors. At the time that the event monitor is turned on, Application 2 has not yet connected.
4) sqlm_stmt_event
      agent_id: 14
      appl_id:  *LOCAL.bourbon.970602180712
      operation:         SQLM_PREPARE
      package_name:      SQLC2BA4
      cursor:            SQLCUR201
      @stmt_text_offset: SELECT EVMONNAME FROM SYSCAT.EVENTMONITORS

5) sqlm_stmt_event
      agent_id: 14
      appl_id:  *LOCAL.bourbon.970602180712
      operation:         SQLM_OPEN
      package_name:      SQLC2BA4
      cursor:            SQLCUR201
      @stmt_text_offset: SELECT EVMONNAME FROM SYSCAT.EVENTMONITORS

6) sqlm_stmt_event
      agent_id: 14
      appl_id:  *LOCAL.bourbon.970602180712
      operation:         SQLM_FETCH
      package_name:      SQLC2BA4
      cursor:            SQLCUR201
      @stmt_text_offset: SELECT EVMONNAME FROM SYSCAT.EVENTMONITORS
      fetch_count:       2
      sqlca.sqlcode:     100  - (all rows in the SYSCAT.EVENTMONITORS table)
      SQL0100W  No row was found for FETCH, UPDATE or DELETE; or the result of a
      query is an empty table.  SQLSTATE=02000
NOTE - A fetch event is generated only if the fetch fails or encounters end of table

7) sqlm_stmt_event
      agent_id: 14
      appl_id:  *LOCAL.bourbon.970602180712
      operation:         SQLM_DESCRIBE
      package_name:      SQLC2BA4
      cursor:            SQLCUR201
      @stmt_text_offset: SELECT EVMONNAME FROM SYSCAT.EVENTMONITORS

8) sqlm_stmt_event
      agent_id: 14
      appl_id:  *LOCAL.bourbon.970602180712
      operation:         SQLM_CLOSE
      package_name:      SQLC2BA4
      cursor:            SQLCUR201
      @stmt_text_offset: SELECT EVMONNAME FROM SYSCAT.EVENTMONITORS
      fetch_count:       2

9) sqlm_stmt_event
      agent_id: 14
      appl_id:  *LOCAL.bourbon.970602180712
      operation:    SQLM_STATIC_COMMIT       - generated by CLP after the SELECT
      package_name: SQLC2BA4

10) sqlm_xaction_event
      agent_id: 14
      appl_id:  *LOCAL.bourbon.970602180712
      status:    SQLM_UOWCOMMIT
      rows_read: 7
|
Application 2 is connecting to the database. Output is interleaved, as the DB2 agents are executing simultaneously:
11) sqlm_connheader_event
      agent_id: 15                             - Application 2 - handle
      appl_id:  *LOCAL.bourbon.970602180714    - Application 2 - id with timestamp

12) sqlm_stmt_event
      agent_id: 15
      appl_id:  *LOCAL.bourbon.970602180714
      operation:  SQLM_STATIC_COMMIT          - generated by CLP on CONNECT

13) sqlm_xaction_event
      agent_id: 15
      appl_id:  *LOCAL.bourbon.970602180714
      status:    SQLM_UOWCOMMIT

14) sqlm_stmt_event
      agent_id: 15
      appl_id:  *LOCAL.bourbon.970602180714
      operation:  SQLM_STATIC_COMMIT          - generated on CONNECT RESET

15) sqlm_xaction_event
      agent_id: 15
      appl_id:  *LOCAL.bourbon.970602180714
      status:    SQLM_UOWCOMMIT

16) sqlm_conn_event
      agent_id: 15
      appl_id:  *LOCAL.bourbon.970602180714
      commit_sql_stmts:    2

17) sqlm_stmt_event
      agent_id: 14
      appl_id:  *LOCAL.bourbon.970602180712
      operation:    SQLM_STATIC_COMMIT       - generated on CONNECT RESET
      package_name: SQLC2BA4

18) sqlm_xaction_event
      agent_id: 14
      appl_id:  *LOCAL.bourbon.970602180712
      status:    SQLM_UOWCOMMIT
      rows_read: 2
      locks_held_top: 7

19) sqlm_conn_event
      agent_id: 14
      appl_id:  *LOCAL.bourbon.970602180712
      select_sql_stmts: 1
      rows_selected:    2
|
Epilogue
The Epilogue information is generated during database deactivation (last application finished disconnecting):
20) sqlm_table_event
      table_schema: SYSIBM
      table_name:   SYSTABLES
      table_type:   SQLM_CATALOG_TABLE
      rows_read: 2

21) sqlm_table_event
      table_schema: SYSIBM
      table_name:   SYSDBAUTH
      table_type:   SQLM_CATALOG_TABLE
      rows_read: 3

22) sqlm_tablespace_event
      tablespace_name: SYSCATSPACE

23) sqlm_tablespace_event
      tablespace_name: TEMPSPACE1

24) sqlm_tablespace_event
      tablespace_name: USERSPACE1

25) sqlm_bufferpool_event
      bp_name: IBMDEFAULTBP

26) sqlm_db_event
      connections_top: 2
|
| Note: | A WHERE clause on the CREATE EVENT MONITOR SQL statement can be used to restrict the applications that will generate events; see Appendix A. "Database System Monitor Interfaces" for details. |